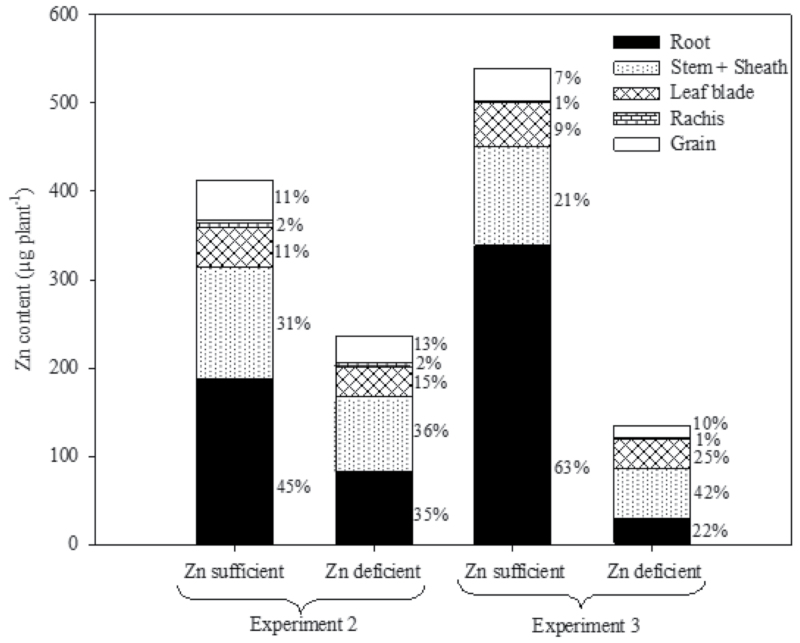
Fig. 3.
Zn allocation to different plant tissues of rice genotypes at maturity under Zn-sufficient and Zn-deficient conditions in Experiments 2 and 3. % values indicate the percent Zn allocation to each tissue within a bar. Values given are average of eight and four genotypes in Experiments 2 and 3, respectively. Grain=brown rice+hull.

