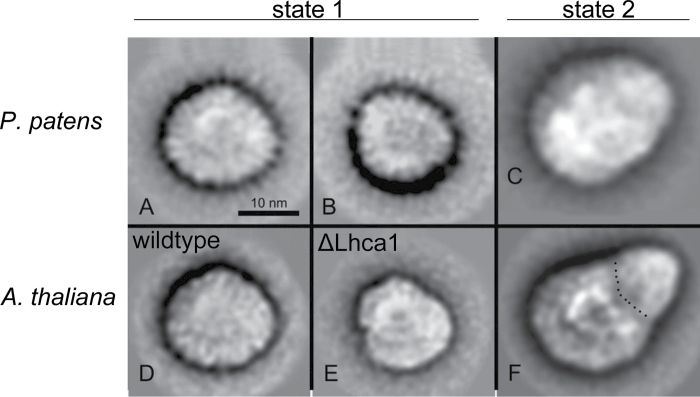
Fig. 4.
Transmission electron microscopy and single-particle analysis of the isolated PSI–LHCI complex of Physcomitrella. Projection maps of PSI from Physcomitrella in state 1 summed from 921 particles (A) and from 395 particles (B), and in state 2 summed from 613 (C), in comparison with Arabidopsis PSI maps from state 1 (D, E) and from state 2 (F). The dotted line indicates the border between the core part and the extra antenna moiety attached under state 2. Parts (D) and (E) have been reproduced from Wientjes et al. (2009); part (F) was reproduced from Galka et al. (2012).

