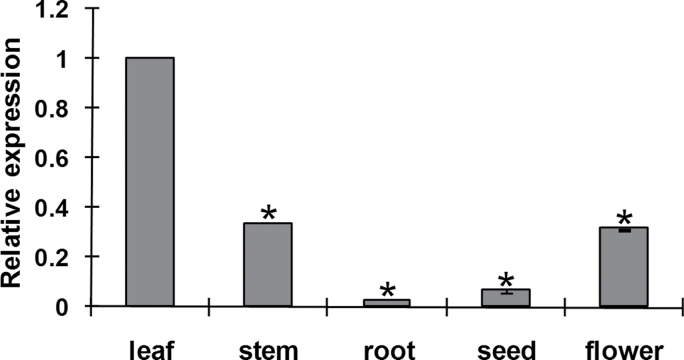
Fig. 2.
Expression pattern of TaLls1 in different wheat tissues. Samples were collected from leaves, stems, roots, seeds, and flowers. Three independent biological replications were performed. Expression levels were normalized to TaEF-1a. Asterisks indicate a significant difference (P <0.05) from the leaf using Student’s t-test.

