Figure 2.

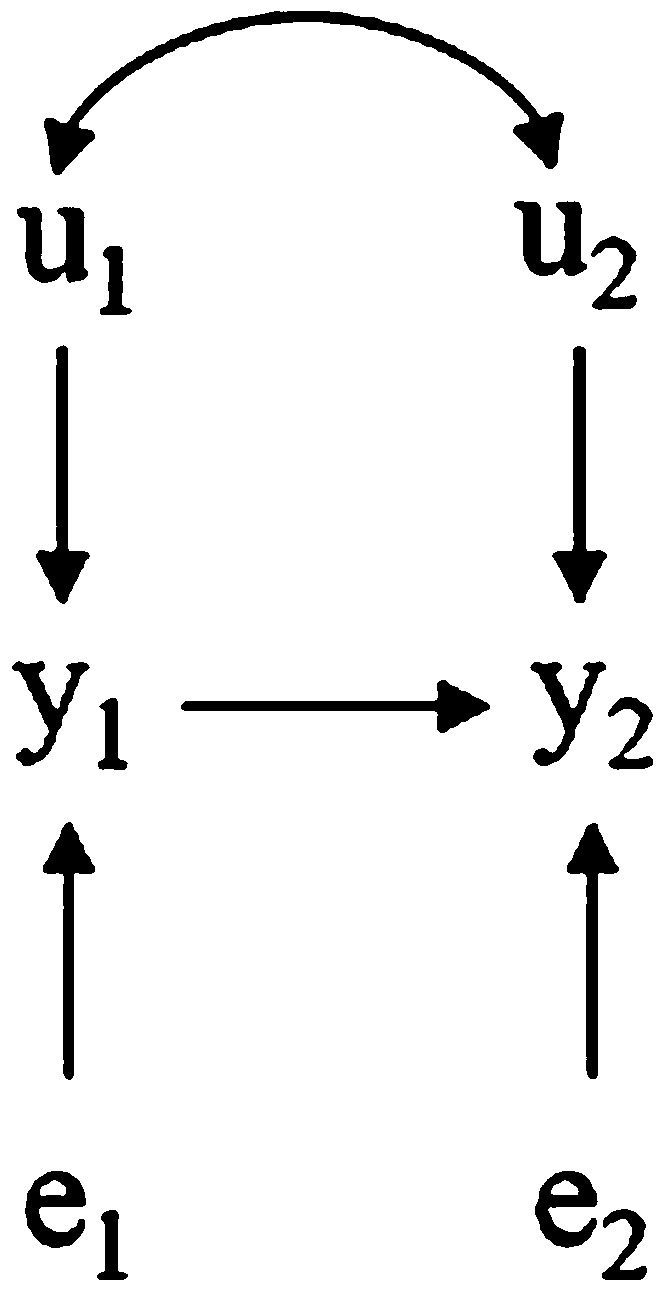
Hypothetical recursive causal structure involving two traits (phenotypes are and ) influenced by direct genetic effects and and by residuals and , respectively. Bidirected arcs connecting the u’s represent genetic correlations.

Hypothetical recursive causal structure involving two traits (phenotypes are and ) influenced by direct genetic effects and and by residuals and , respectively. Bidirected arcs connecting the u’s represent genetic correlations.