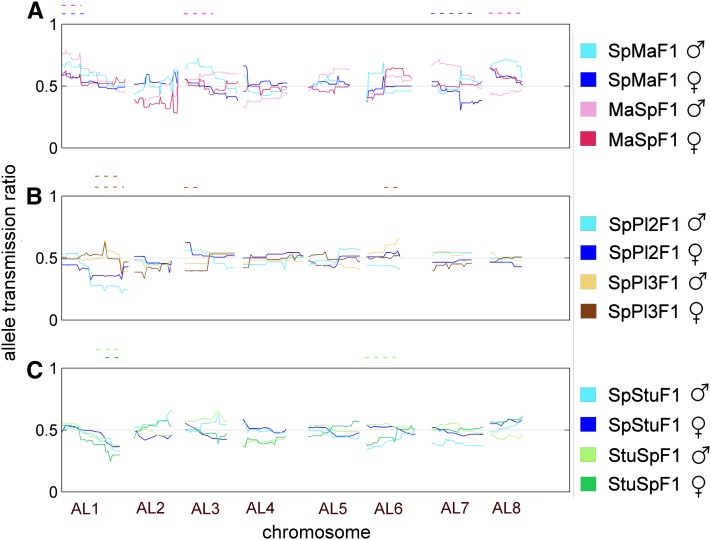
Figure 3.
Allele transmission ratio of Spiterstulen alleles from the F1 to the F2 for each parent, separately in male (light color) and female function (dark color), over all eight chromosomes. (A) Sp × Ma, (B) Sp × Pl, (C) Sp × Stu. F1 parents with Sp cytoplasm are in blue (SpMaF1, Sp1Pl1F1, and SpStuF1). MaSpF1 is in red (A) and StuSpF1 in green (C). The Sp2Pl2F1 parent had cytoplasm from Sp but is represented in brown (B). The Mendelian expectation of equal segregation of both alleles, 0.5, is marked with a gray dashed line. The significant gametic TRD regions have been marked above the chromosomes as in Figure 2.

