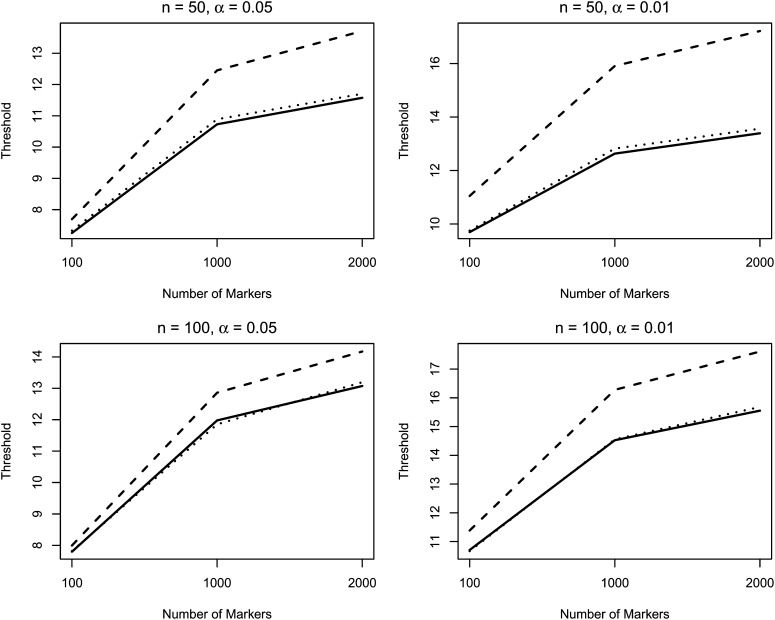
Figure 1.
Thresholds at the targeted GWS levels of α. The solid, dashed, and dotted curves correspond to the average thresholds based on the proposed method and the method of Zou et al. (2004) from 10,000 simulated data sets and the empirical thresholds based on 10,000 simulated data sets under the null hypothesis, respectively.

