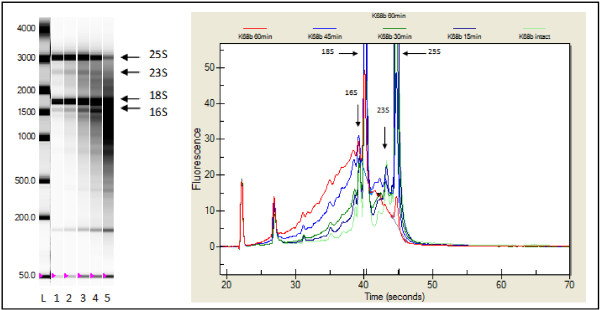
Figure 3.

RNA quality control with the Experion (Bio-Rad). Electropherogram (right) and virtual gel-view (left) of an RNA degradation series that was constructed by heating an RNA sample for 0, 15, 30, 45 and 60 min at 80°C. The loading marker and small RNA band and cytoplasmic 18S and 25S as well as 16S and 23S chloroplast and mitochondrial ribosomal bands are indicated with arrows. Lanes: (L) size standard, (1) intact RNA, (2) 15 min, (3) 30 min, (4) 45 min, (5) 60 min. Intensity settings can vary between lanes.
