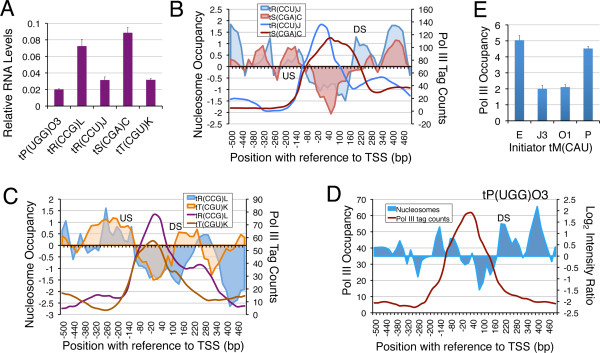
Figure 5.

DS nucleosome is inhibitory for transcription. A) Relative RNA levels estimated by using five of the unique primer sets which could be designed for the five examples shown. Panels B-D) Comparison of nucleosome occupancy profiles with similar pol III levels on different genes. US and DS nucleosomes are marked. B) Comparison of nucleosome occupancy (shaded areas) profiles for tR(CCU)J and tS(CGA)C which have similar pol III levels (solid lines). Higher nucleosome density in downstream region and lower RNA levels of tR(CCU)J suggest that higher nucleosome occupancy in downstream region could be inhibitory for transcription. C) Comparison of nucleosome occupancy (shaded areas) profiles for tR(CCG)L and tT(CGU)K which have similar pol III levels. Higher nucleosome density in downstream region and lower RNA levels of tT(CGU)K suggest that higher nucleosome occupancy in downstream region could be inhibitory for transcription. The tT(CGU)K DNA has a shorter NFR and higher nucleosome occupancy even in the upstream region. D) On tP(UGG)O3 gene, the high nucleosome occupancy on both the gene ends may be inhibitory for transcription, despite similar pol III levels. E) Pol III occupancy (fold enrichment over mock sample, from ChIP-seq data) on initiator tRNAMet (IMT) genes is shown. Average with scatter from three independent experiments is plotted.
