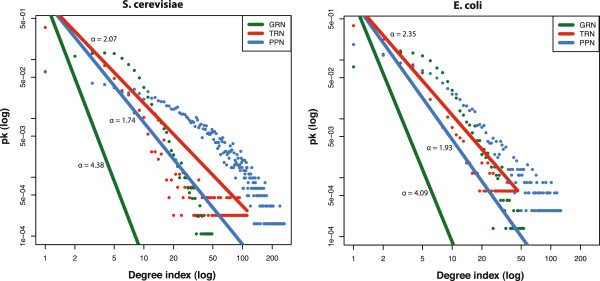
Figure 2.

Comparison of the log10-log10 degree and fitted power-law distribution for the gene regulatory network (GRN), transcriptional regulatory network (TRN) and protein-protein interaction network (PPI) of S. cerevisiae and E. coli.

Comparison of the log10-log10 degree and fitted power-law distribution for the gene regulatory network (GRN), transcriptional regulatory network (TRN) and protein-protein interaction network (PPI) of S. cerevisiae and E. coli.