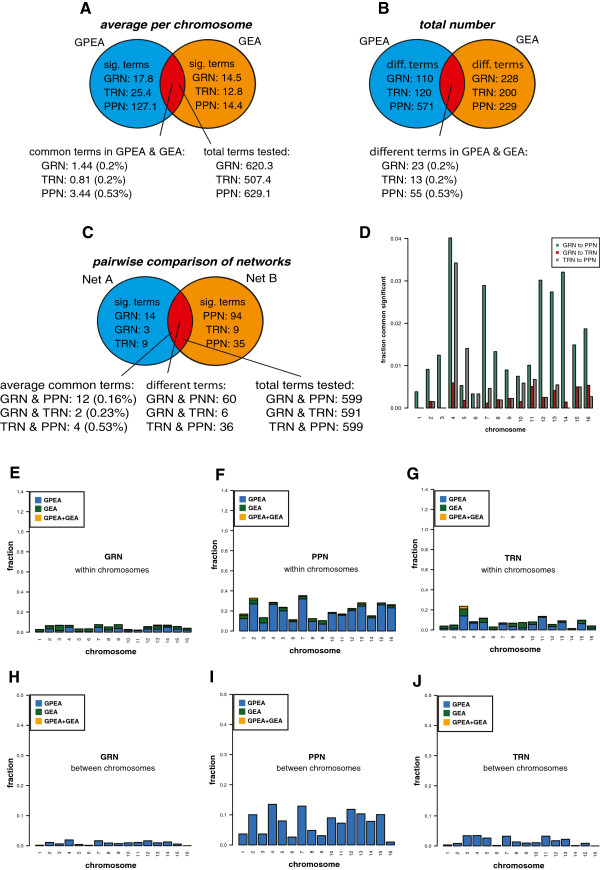
Figure 9.
Results for S. cerevisiae. Summary of the GPEA and GEA, showing average results per chromosome (A), total numbers (B) of significant terms and pairwise comparison of networks (C). D: Fraction of common significant terms for the GPEA analysis, between the GRN, TRN and PPN. E-J: Fraction of significant GO Biological Process terms for GPEA, GEA and GPEA+GEA overlap analysis for individual chromosomes. E-G show results within chromosomes and H-J between chromosomes.

