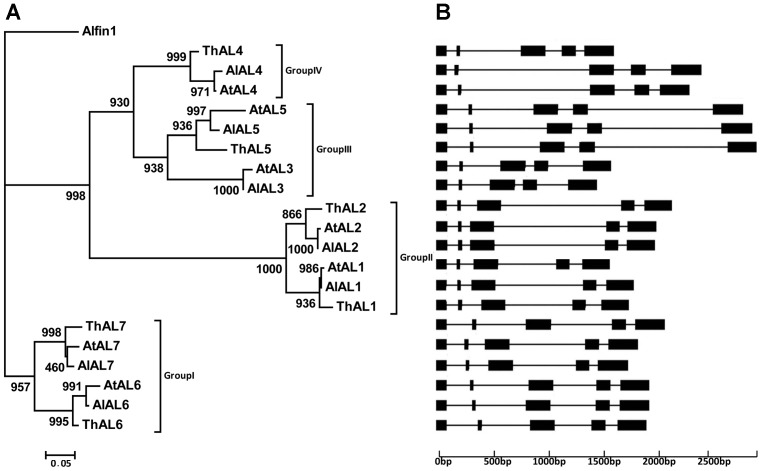
Figure 1. Phylogenetic analysis and gene structure of AL proteins in A. lyrata, A. thaliana, and T. halophila.
A. The tree was constructed from a complete alignment of 21 AL proteins by maximum likelihood (ML) method with bootstrapping analysis (1000 reiterations). In ML methods, the evolutionary model was JTT+G which determined by ModelGenerator v0.84 software. B. The horizontal lines indicated the position of introns and the black boxes represented the location of exons.

