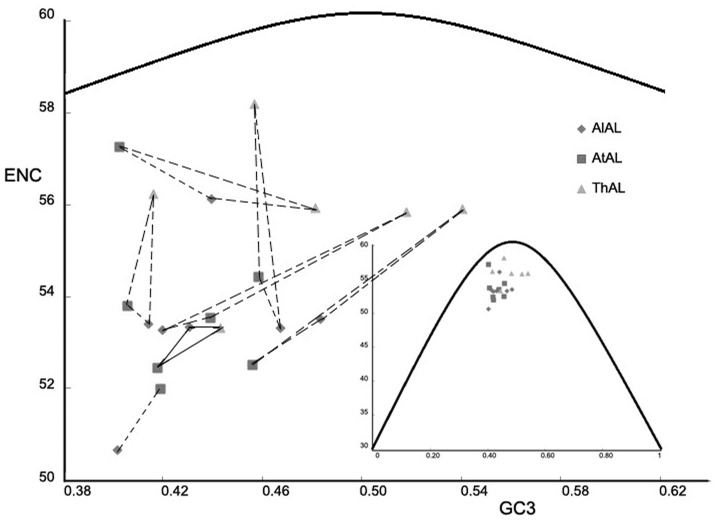
Figure 3. Effective number of codons (ENC) used in a gene versus the percent GC at third codon positions (GC3) for AL genes of A. lyrata, A. thaliana, and T. halophila.
The solid curve was the expectation of the ENC under the assumption of no selection on codon usage. The three markers connected with solid line indicate the values of AL7 genes in A. lyrata, A. thaliana, and T. halophila, and the other three markers connected with dotted line indicate the values of other AL genes in A. lyrata, A. thaliana, and T. halophila.

