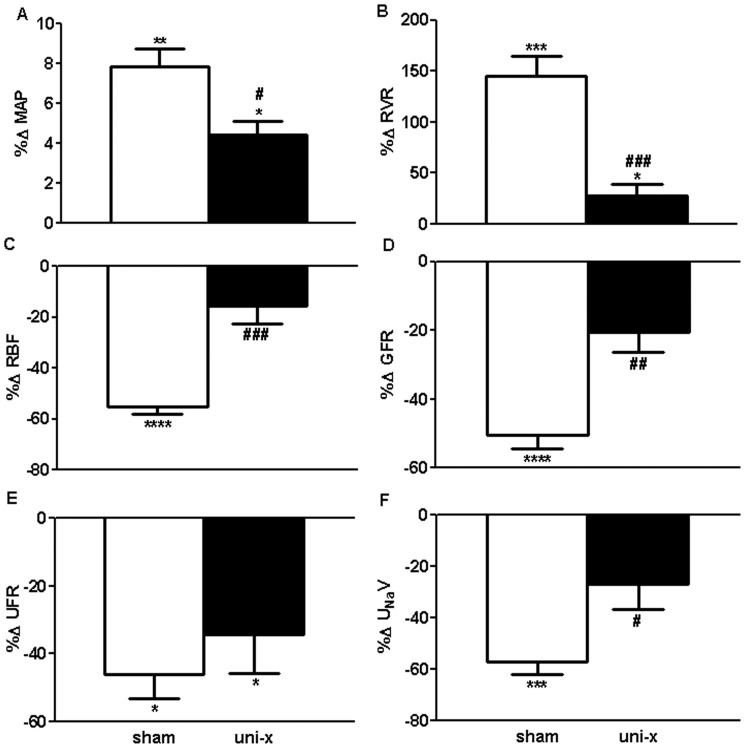
Figure 1. Cardiovascular and renal responses to intravenous infusion of low pressor dose angiotensin II (AngII) expressed as percentage change (%Δ) from basal period 1 in sham and uni-x female sheep at 5 years of age (n = 5/group).
MAP, mean arterial pressure; RVR, renal vascular resistance; RBF, renal blood flow; GFR, glomerular filtration rate; UFR, urine flow rate; UNaV, urinary sodium excretion; all values except MAP are corrected for total kidney weight (gkw). Sham: white bars, uni-x: black bars, *P<0.05, ***P<0.001, ****P<0.0001 from Bonferroni post-hoc test comparing responses of sham or uni-x animals to AngII infusion from their basal period 1. #P<0.05, ##P<0.01, ###P<0.001 from student’s t-test comparing sham and uni-x. Values are mean ± SEM.

