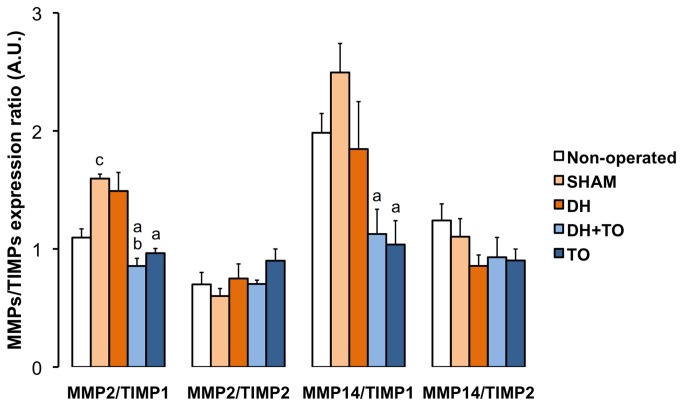
Figure 6. Gene expression ratios between MMPs and TIMPs in the fetal rabbit model for CDH undergoing TO.
Mean Cq values for each gene were converted into linear values according to the efficiency corrected model, and normalized to the geometric mean of SDHA and TOP1 as calculated by genorm. Normalized values for MMP2 and MMP14 were then expressed relative to normalized values for TIMP1 and TIMP2. Error bars illustrate the standard error of the mean, with 4 to 5 animals per study group. One-way ANOVA with Bonferroni correction was used for comparisons between surgical groups (SHAM, DH, DH+ TO, and TO) and unpaired Student’s t-test for comparisons between non-operated and SHAM fetuses. SHAM, sham-operated fetuses; DH, diaphragmatic hernia fetuses; DH+ TO, DH fetuses with tracheal occlusion; TO, sham DH fetuses with TO. a P < 0.05 vs SHAM; b P < 0.05 vs DH; c P < 0.05 vs non-operated. A.U. = arbitrary unit.

