
Figure 4. Hierarchical clustering of miRNA expression.
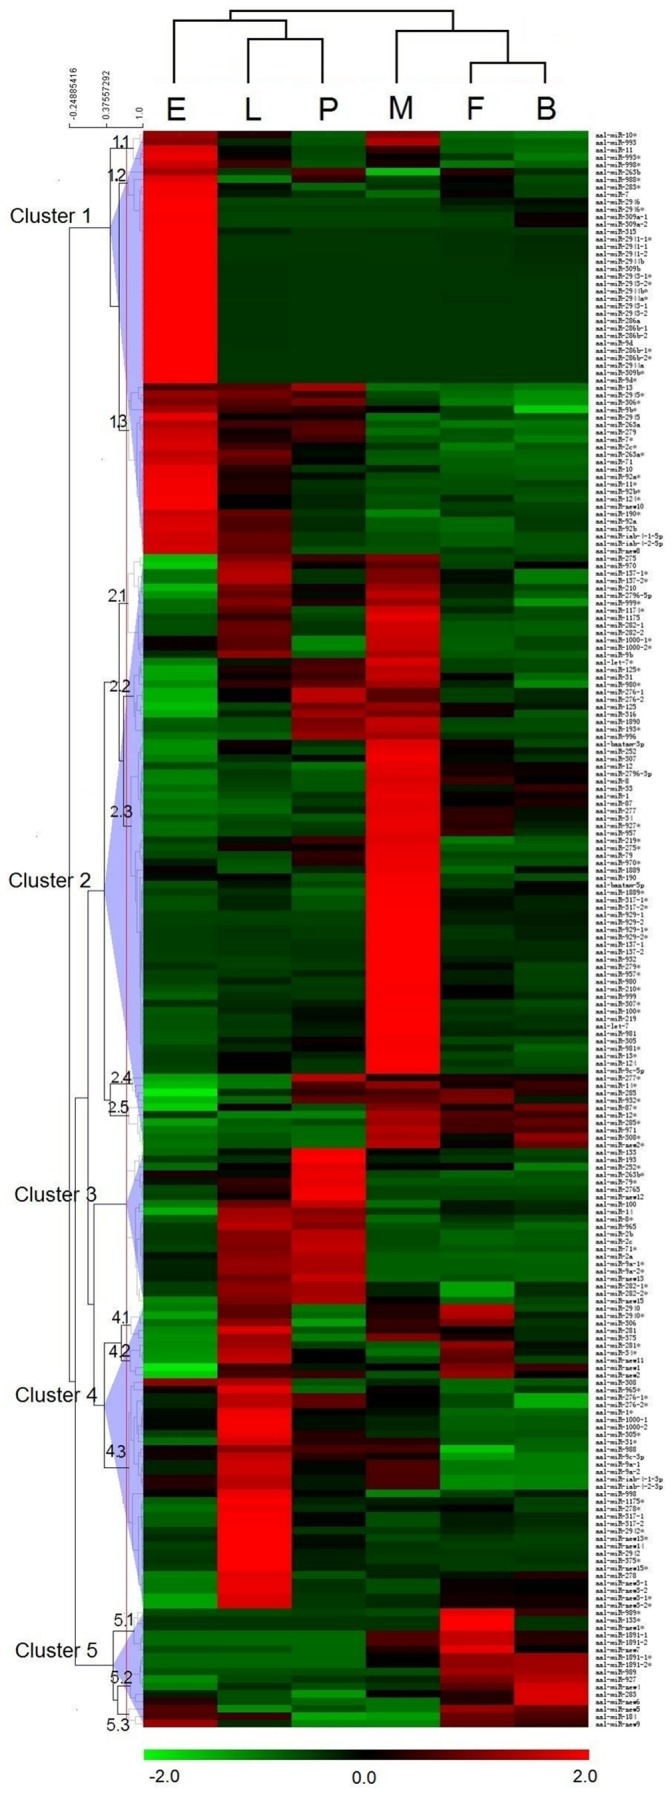
Normalized expression profiles of 215 miRNA/miRNA*s from six different developmental stages were clustered. Stages are in columns and miRNAs in rows. Red indicates that a gene is represented highly at the stage, whereas green indicates the opposite. miRNAs with similar expression patterns cluster together. There are five Clusters (1–5) with variable numbers of sub-clusters. Abbreviations: E, embryos; L, larvae; P, pupae; M, adult males; F, adult females and B, blood-fed adult females.