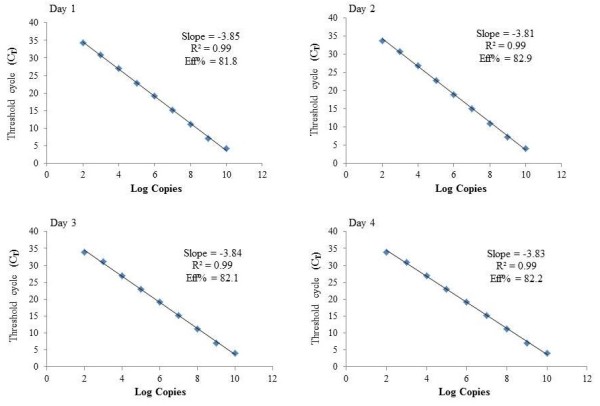
Figure 1.

SYBR Green based standard curve from two independent 10 fold serial dilutions of plasmid standards. Standard curve was plotted in the sample plasmid on the x-axis and threshold cycle (CT) on the y-axis. The x-axis represents human TTV in 10-fold dilutions (Log copies) and the y-axis the fluorescence data used for CT determinations in ∆Rn (baseline-corrected normalized fluorescence). Assay was in linear range of Human TTV with R2 values (square of the correlation coefficient) of 0.99.
