
Figure 2.
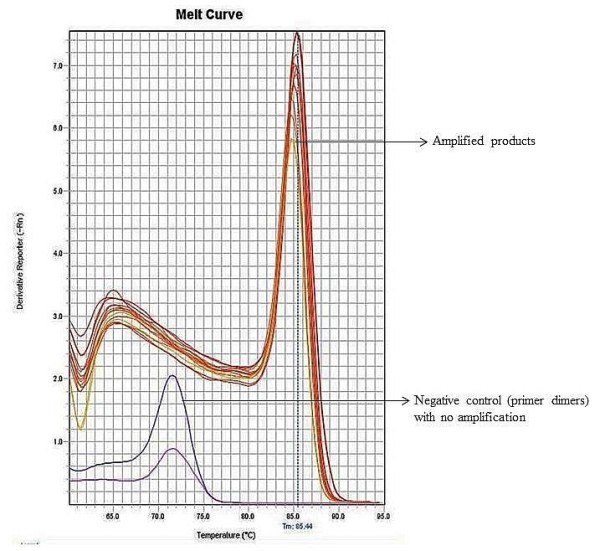
Melting curve analysis of TTV real-time PCR products. Y-axis represents the derivative reporter (∆Rn) while x-axis represents the temperature (°C). The figure shows a melting temperature (Tm) of human TTV PCR products as 85.4°C with no amplifications detected in negative controls except primer-dimers.