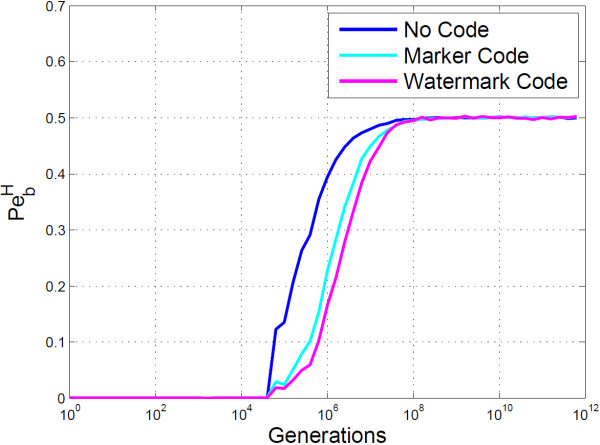
Figure 10.
Empirical analysis of BioCode-pcDNA using resynchronisation error correction. Shown is the probability of bit error using the Hamming distance for BioCode pcDNA alone (blue), BioCode pcDNA using a marker code (light blue) and BioCode pcDNA using a watermark code (purple). The gene used was the “ftsZ” gene.

