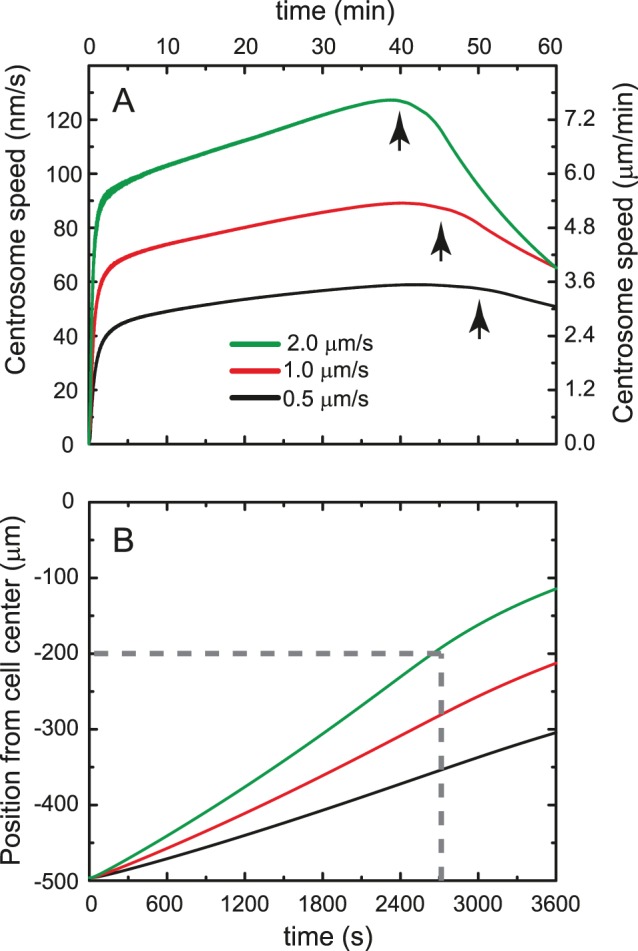
Figure 2. Centrosome dynamics as a function of vesicle velocity.

(A) After an initial ramp up, the centrosome velocity keeps increasing at a much smaller rate. As the difference in number of vesicles moving along microtubules in the far and near cortical sides decreases, the centrosome slows down (arrows). Given that slower vesicles experience a smaller drag force, they lead to a slower centrosome. (B) The corresponding position of the centrosome shows that the small, fast-moving vesicles are sufficient to move the centrosome distances comparable to the motion of the centrosome in fertilized Xenopus laevis embryos. Experiments show that the centrosome moves at least 300 µm in 45 minutes; the dashed lines delineate that region. (calculation parameters: 100 microtubules; 100 nm diameter vesicles; viscosity ratio = 3; 2 vesicles/µm; 250 nm/s MT polymerization rate; vesicle velocity as indicated: 2 µm/s (green), 1 µm/s (red), 0.5 µm/s (black) in that order from top to bottom).
