Figure 1.

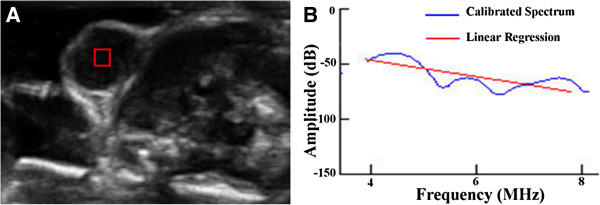
Ultrasound image and power spectrum. (A) Ultrasound image of the MCF7 tumor with the ROI located in the subcutaneous tumor tissue and (B) the corresponding calibrated power spectrum (blue curve) with linear regression (red line).

Ultrasound image and power spectrum. (A) Ultrasound image of the MCF7 tumor with the ROI located in the subcutaneous tumor tissue and (B) the corresponding calibrated power spectrum (blue curve) with linear regression (red line).