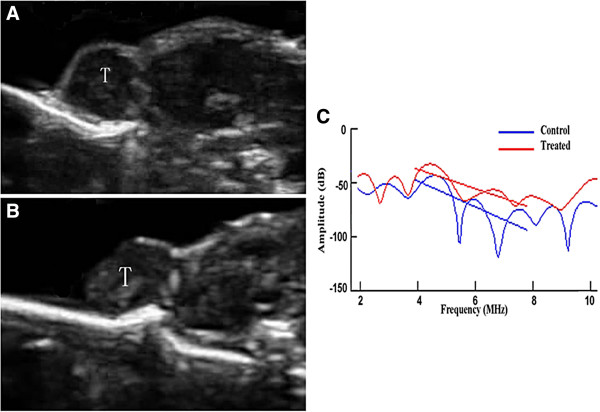
Figure 3.

Representative ultrasound images and corresponding ultrasound spectral parameters. Ultrasound images for (A) a control tumor and (B) a treated tumor, and the corresponding ultrasound spectral parameter (C) characterization of tumor responses to chemotherapy. The ultrasound images showed a noticeably brighter grayscale intensity in treated tumors (B) relative to control tumors (A). (C) Ultrasonic spectral analysis indicated a separation of the regression line between the control and the treated tumors.
