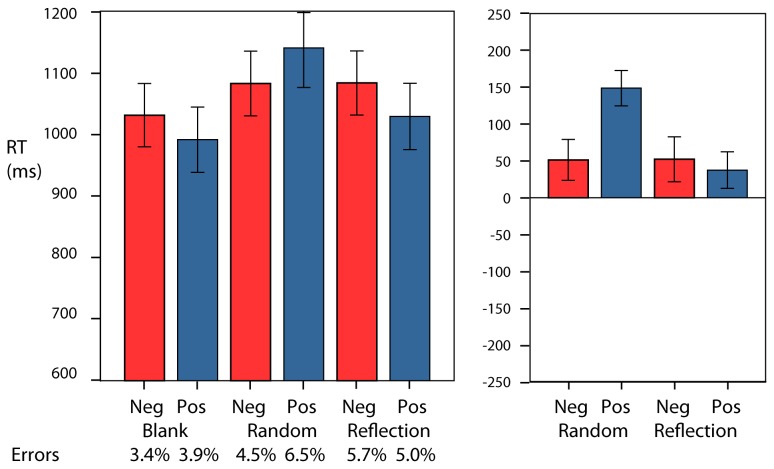
Figure 5. Mean RT and error rates for Experiment 7.
On the right the results for Random and Reflection are replotted after subtracting the baseline (Blank) for negative and positive words. Values above zero show the degree to which the responses are slowed in each condition. The error bars are ±1SEM.

