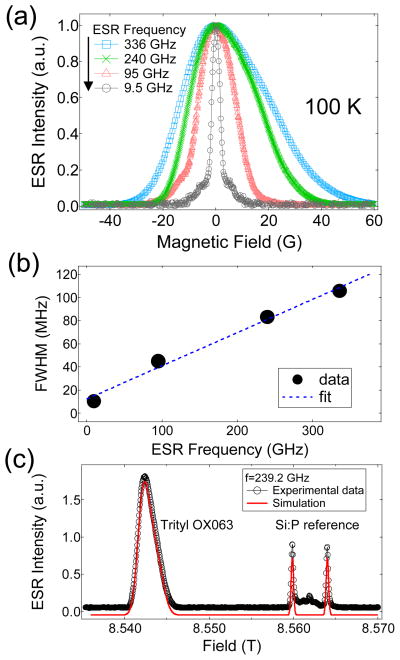
Fig. 4.
(a) Normalized field-swept ESR spectra of trityl OX063 (15 mM in 1:1 v/v glycerol:water) at multiple ESR frequencies: 9.5 GHz, 95 GHz, 240 GHz, and 336 GHz measured at 100 K. (b) The corresponding full-width at half-maximum (FWHM) of the ESR spectra at different magnetic fields. The solid line is a fit to a linear equation. (c) Field-swept ESR spectrum at 239.2 GHz showing the signals emanating from trityl OX063 and the Si:P reference sample. The solid curve represents the simulated spectrum where the g-tensor values were extracted.

