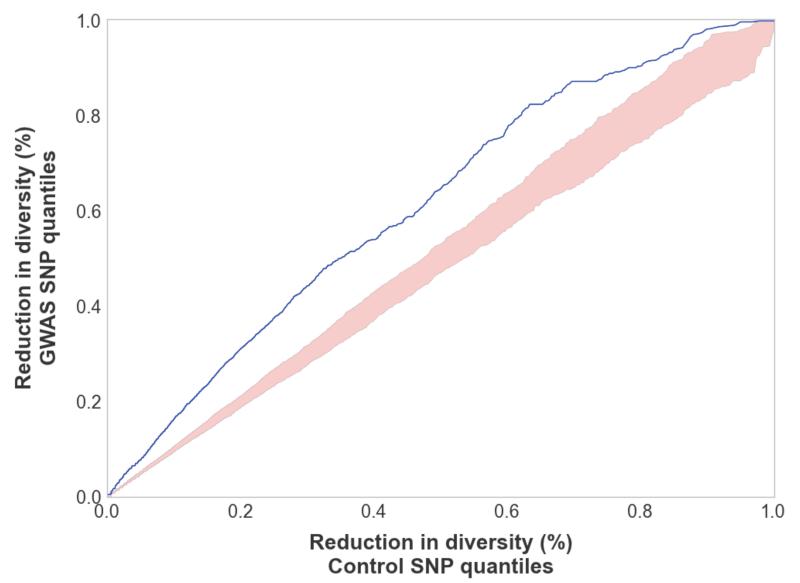
Figure 1.
GWAS SNPs for complex traits are significantly more impacted by background selection than are control SNPs in HapMap (41) (chosen to match the frequency and genetic distance to closest gene of GWAS SNPs). In blue is a QQ-plot comparing the background selection scores for GWAS quantiles versus the background selection score for control SNPs. In pink is the entire range of background scores for each quantile across 1000 independently drawn control sets.

