Figure 2.
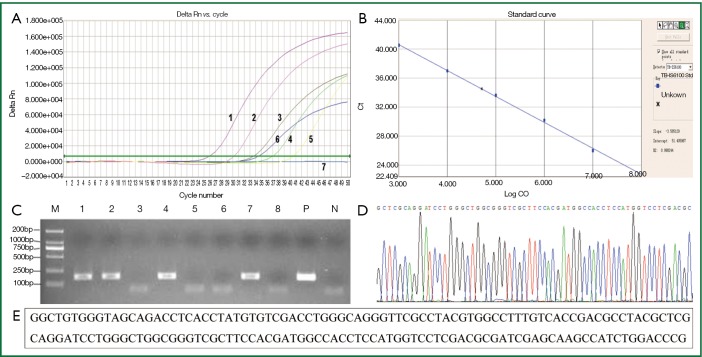
Fluorescent quantitative PCR amplification curve for the standard and test samples and the standard curve of MTB DNA. A. Fluorescent quantitative PCR amplification curve: 1, standard sample, 1×10⁷ copies/mL; 2, standard sample, 1×10⁶ copies/mL; 3, standard sample, 1×10⁵ copies/mL; 4, standard sample, 1×10⁴ copies/mL; 5, standard sample, 1×10³ copies/mL; 6, test sample of tuberculosis; 7, H2O; B. Standard curve of MTB DNA: Std, positive standard samples; unknown, test sample; C. Electrophoresis of fluorescent quantitative PCR amplification products: M, DNA marker (DL2000); 1-8, plasma/serum samples from tuberculosis patient 1-8; P, positive control; N, negative control; D. Sequence figure of MTB DNA amplification product; E. DNA sequence of MTB DNA amplification product.

