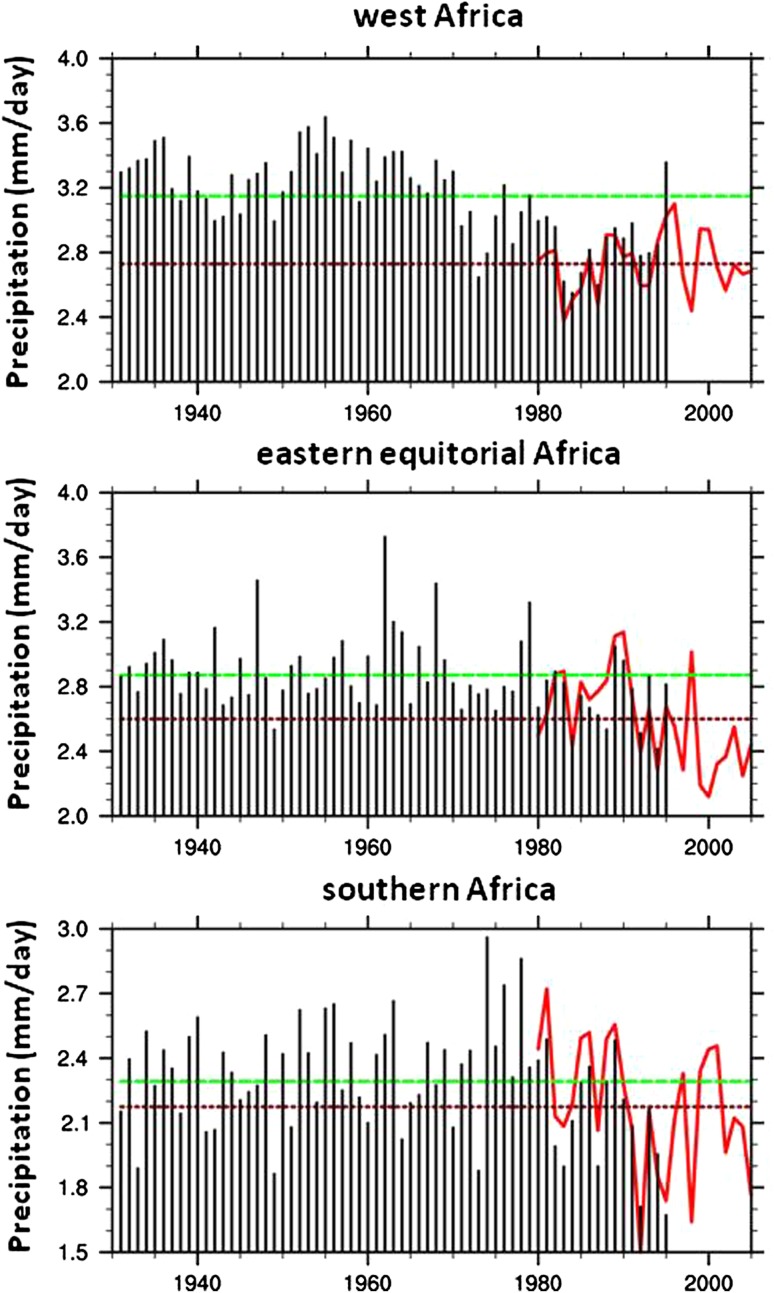
Fig. 1.
Regional averages of annual mean precipitation for three regions of Africa illustrating differential drying of the continent during the latter decades of the 20th century. Black bars are based on 1930–1995 data from the Climatic Research Unit of the University of East Anglia (Hulme 1992). More recent annual mean data (1979–2005) depicted by the solid red line come from the Global Precipitation Climatology Project (Huffman et al. 1997). The separation between the solid green and dashed red horizontal lines depicts the shift in annual means during the two time periods considered. From Giannini et al. (2008); used with permission

