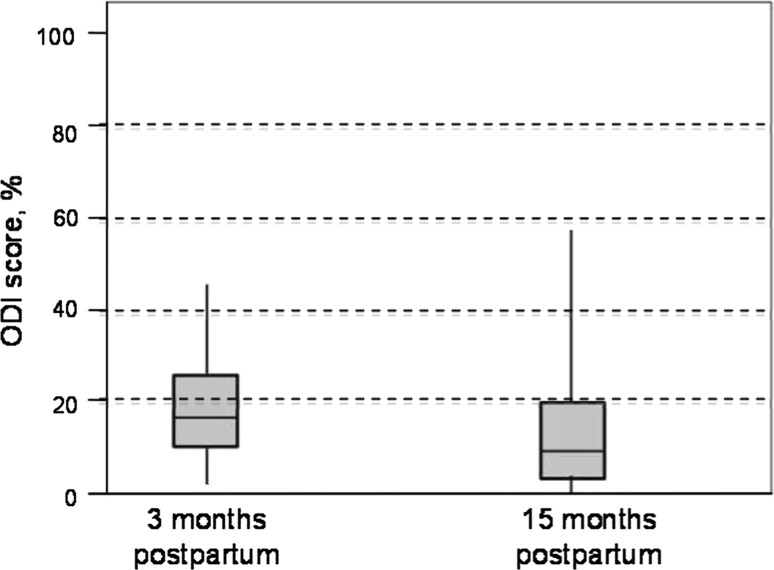
Fig. 2.
Distribution of Oswestry (ODI) score at approximately 3 months postpartum (baseline) and 15 months postpartum. Median values given by horizontal line, boxes show the interquartiles and whiskars the range. P < 0.01; n = 50; scale range from 0 to 100 %, 0–20 % = minimal disability; 21–40 % = moderate disability; 41–60 % = severe disability; 61–80 % = crippled; 81–100 % = bedbound or exaggerating the symptoms

