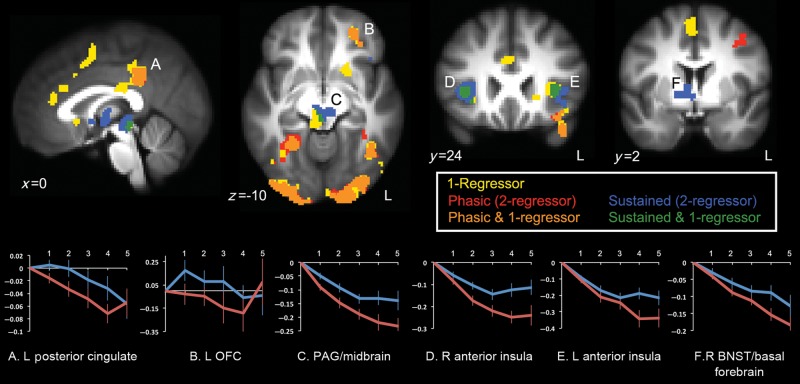
Figure 2.
(Top panel) Anticipatory activation for the 1-regressor model (yellow), and phasic (red) and sustained anticipatory activation (blue) for the 2-regressor model at P < 0.05 (corrected using Monte Carlo simulation). Overlap between 1-regressor and phasic clusters is shown in orange; overlap between 1-regressor and sustained clusters is shown in green. Activation of the posterior cingulate (A) and the left OFC (B) in the 1-regressor model was attributed to the phasic regressor in the 2-regressor model. Activation of the midbrain/PAG (C) and bilateral anterior insula (D/E) in the 1-regressor model was attributed to the sustained regressor in the 2-regressor model. Sustained activity was observed in the right basal forebrain including the BNST (F), whereas no activity was observed in this region for the 1-regressor model. At the corrected threshold, neither regressor in the 2-regressor model independently accounted for the rostral cingulate activation in the 1-regressor model (Fig. 4A and Supplementary Fig. S1). (Bottom panel) Time course data extracted from clusters showing significant phasic (A,B) and sustained (C–F) activity. The x-axis reflects 2-s volumes from the cue onset and the y-axis reflects percent signal change from the baseline. The error bars (standard errors of the mean) increase in magnitude for later time points, which contained fewer averages.

