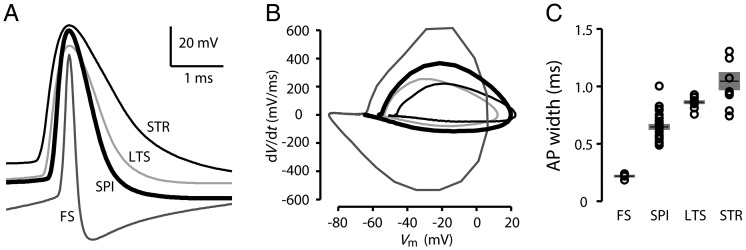
Figure 3.
Width of APs evoked by current steps in corticospinal neurons compared with other cell types. (A) Example AP waveforms from a corticospinal neuron (SPI), corticostriatal neuron (STR), FS interneuron (FS), and LTS interneuron (LTS). (B) Phase plots of same APs shown in (A). (C) Plot of AP width, group data. Bars: mean ± SEM.

