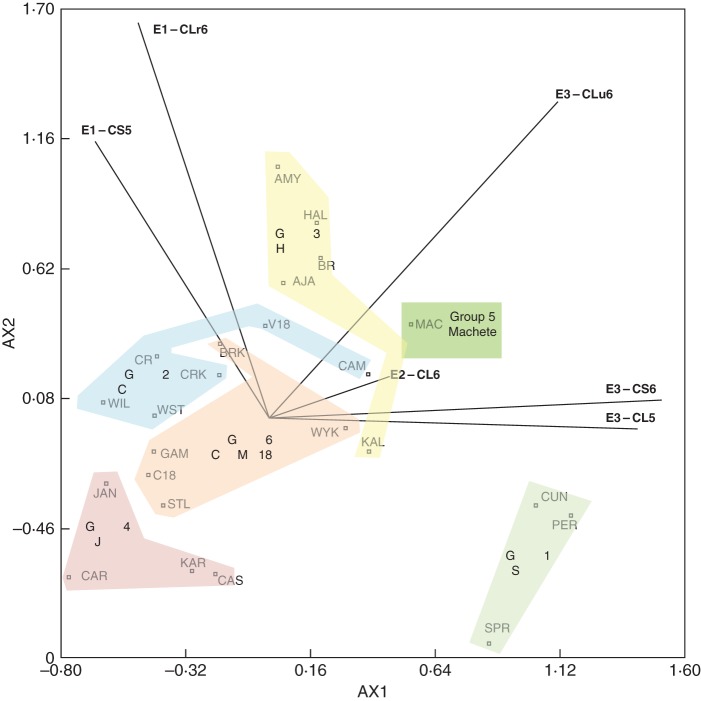
Fig. 3.
Principal component analysis (environment standardized) for the environment × genotype interaction for AX1 and AX2 for root depth for 6 environments and 24 wheat genotypes. Probe genotypes are identified. The G × E interaction for AX1 and AX2 accounted for 54·2 % of the sum of squares. Modified from Botwright Acuña and Wade (2012) with permission from the publisher.

