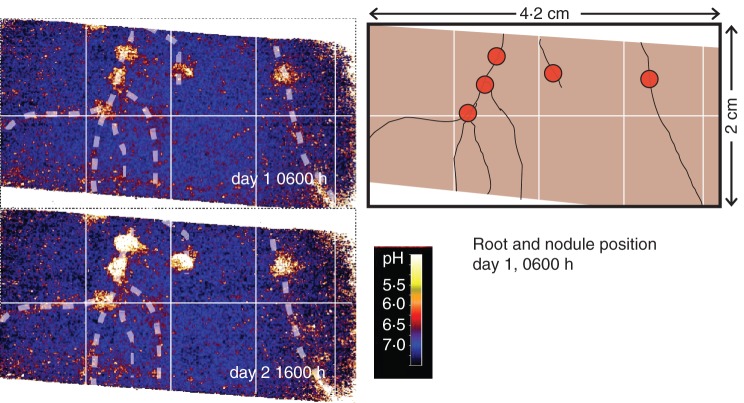
Fig. 2.
The two pH maps display the lowest and highest pH values around chickpea nodules, taken from a 48-h pH monitoring. White dotted lines and schematic drawing mark the position of roots and nodules (red circles). For additional images of pH dynamics we refer to the video sequences in Supplementary Data Video S2.

