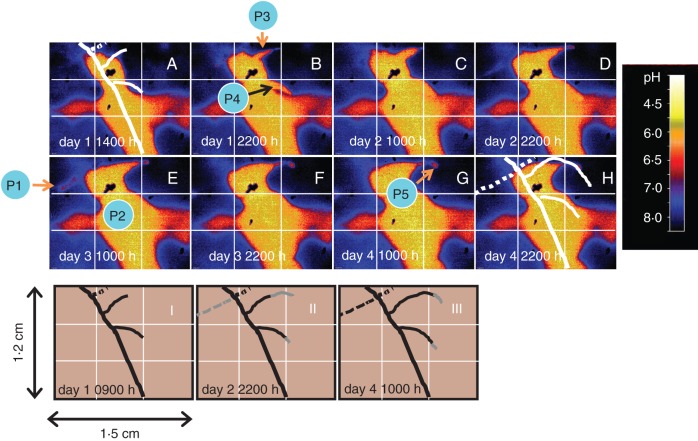
Fig. 3.
(A–H) The eight pH maps display the dynamics of pH values around intercropped chickpea and wheat roots, taken from a 223-h pH monitoring (white labelling indicates day of the experiment and hours of the day). White lines mark the position of roots (solid = chickpea; dashed = wheat). I–III: estimated position of the roots behind planar optode during the course of the experiment; grey lines indicate root growth compared with day 1 of experiment. Key points are: elongation zone of wheat root (P1), chickpea root (P2), basal parts of lateral chickpea roots (P3, P4) and tip of lateral chickpea root (P5). For additional images of pH dynamics we refer to the video sequence in Supplementary Data Video S3.

