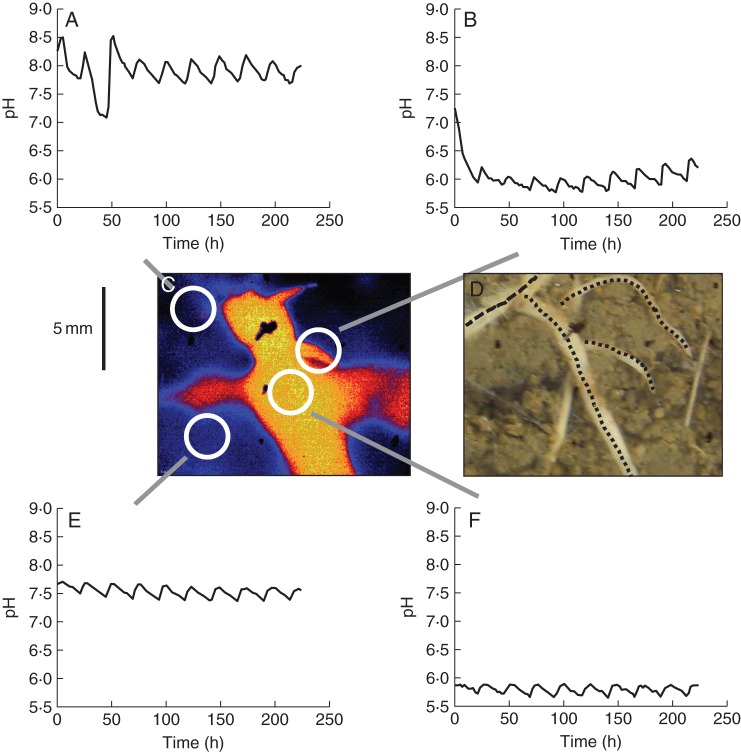
Fig. 4.
(A–F) Line graphs displaying the diurnal pattern of pH values of selected areas around intercropped chickpea and wheat roots, taken from a 223-h pH monitoring (A = wheat root, B = basal part of chickpea lateral root, E = area without visible roots, F = chickpea root). White circles in the pH false colour map (C) indicate the corresponding source area for line graphs. Black lines in the photograph (D, taken at the end of the experiment) indicate roots that were grown during this phase of the experiment (dotted = chickpea; dashed = wheat). Other visible roots were grown in a later phase of the experiment. For additional images of pH dynamics we refer to the video sequence in Supplementary Data Video S3.

