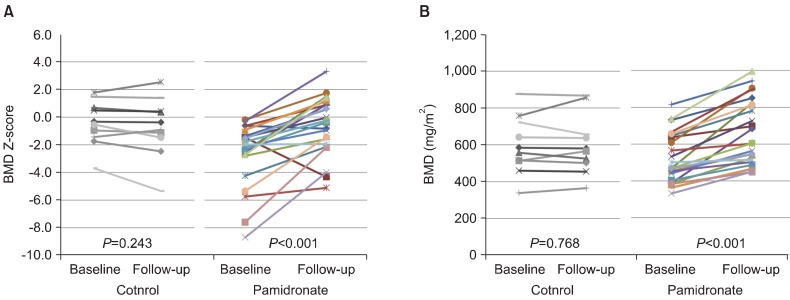
Fig. 1.
(A) Changes in the bone mineral density (BMD) Z-scores. Graph shows the BMD Z-scores for each patient in the control and pamidronate groups at baseline and after follow-up. Eight of the 10 control group patients had decreased BMD Z-scores, and 22 of the 24 pamidronate group patients had increased BMD Z-scores. (B) Changes in BMD (mg/cm2). Graph shows the BMD for each patient in the control and pamidronate groups at baseline and after follow-up. The BMDs of all pamidronate group patients increased after pamidronate therapy; however, the BMDs of 8 control group patients (N=10) decreased.

