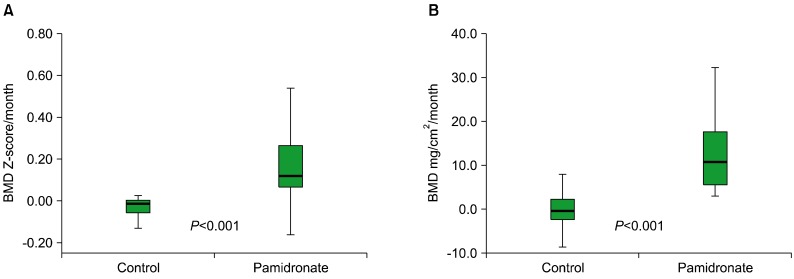
Fig. 2.
(A) The monthly BMD Z-score increases in the control and pamidronate groups were -0.024±0.097 and +0.193±0.201, respectively (P<0.001). The median, 25th and 75th percentiles (box), and ranges of BMD changes (whiskers) are shown. (B) Changes in the BMD per month (mg/cm2/month) in the control and pamidronate groups were -0.29±4.31 and +11.92±6.98, respectively (P<0.001). The median, 25th and 75th percentiles (box), and ranges of the BMD changes (whiskers) are shown.

