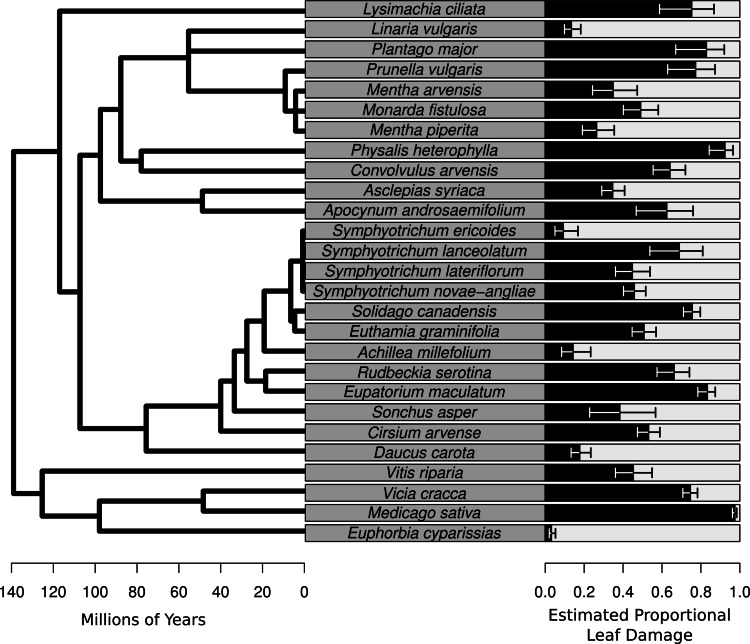
Figure 2. Species-level herbivory of the 27 species for which herbivore damage measurements were taken.
On the left is the phylogenetic relationships of the species with branch length representing time since divergence. On the right is a bar chart whose bars represent the best linear unbiased predictors (BLUPs) or conditional modes of the estimated proportional leaf damage for each species. Error bars are based on the conditional variance-covariance matrix generated by the model fitting procedure (lmer function in the lme4 package for R) and are conditional mode + /− 1 conditional standard deviation.

