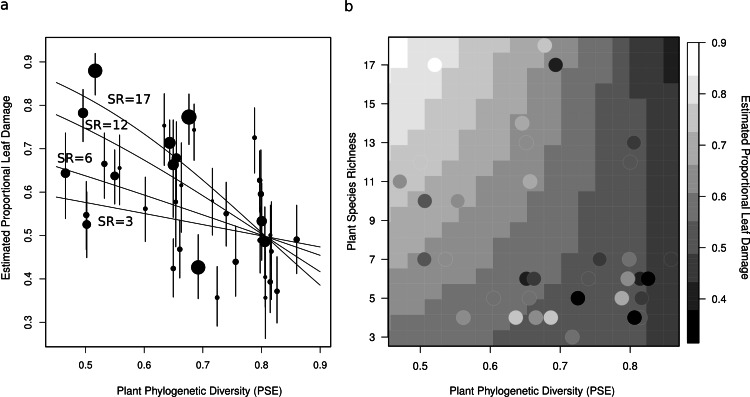
Figure 3. Two figures showing the relationship between estimated proportional leaf damage and plot-level plant species richness and phylogenetic diversity.
(A) Points represent best linear unbiased predictors (BLUPs) or conditional modes of plots. The size of the points is proportional to the species richness of the plot so that large points are speciose communities. Error bars are based on the conditional variance-covariance matrix generated by the model fitting procedure (lmer function in the lme4 package for R) and are conditional mode + /− 1 conditional standard deviation. Fitted lines are back-transformed predicted values from the full generalized linear mixed model, for four different pre-set values of species richness (3, 6, 12, & 17) representing the full range of species richnesses in this study. (B) A heatmap which shows the back-transformed fitted surface of the full generalized linear mixed model. Points are the plot BLUPs, their colour represents their value as per the legend. Points that are darker than the surrounding colour fall below the predicted surface; points which are lighter fall above it.

