Figure 3.
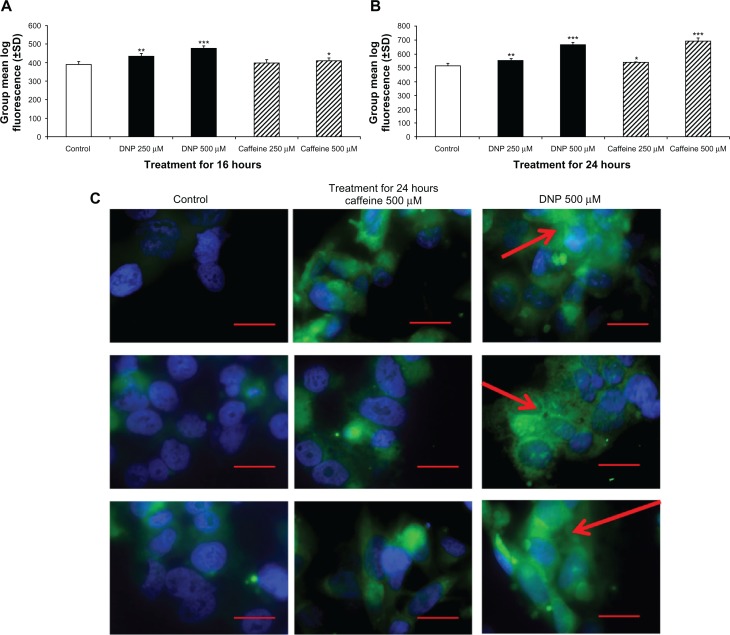
Changes in mitochondrial content. (A) Group mean log fluorescence from flow cytometry of rhabdomyosarcoma cells treated with either ethanol control (final concentration 0.1%), DNP 500 or 250 μM, or caffeine at 500 or 250 μM for 16 hours stained with 200 nM Mitotracker Green. (B) Group mean log fluorescence from flow cytometry of cells treated and stained as described above for 24 hours. (C) Microscopy of cells treated as described above for 24 hours and stained with Mitotracker (green) and DAPI (blue).
Notes: Red bar denotes 50 μm and red arrow denotes mitochondrial networking.

