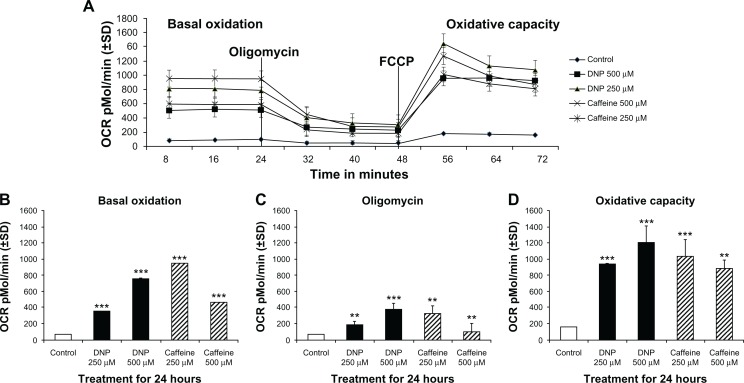
Figure 5.
(A) Group mean oxygen consumption rate (OCR) in pMol/min of rhabdomyosarcoma cells treated with either ethanol control (final concentration 0.1%), DNP at 500 or 250 μM, or caffeine at 500 or 250 μM for 24 hours. (B) Basal OCR of cells treated as described above for 24 hours. (C) OCR of cells treated as described above for 24 hours following addition of oligomycin (Proton Leak). (D) Maximum OCR of cells treated as described above for 24 hours following with FCCP in addition to oligomycin.
Notes: * indicates P < 0.05, ** indicates P < 0.01, and *** indicates P < 0.001 compared with control.

