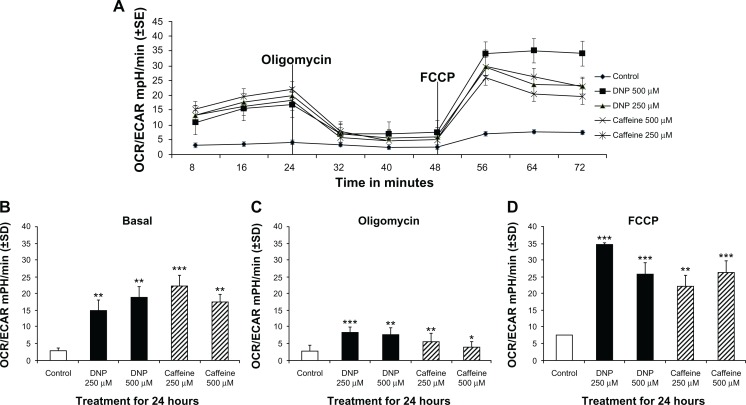
Figure 6.
(A) Group mean OCR/ECAR in mpH/min of rhabdomyosarcoma cells treated with either ethanol control (final concentration 0.1%), DNP at 500 or 250 μM, or caffeine at 500 or 250 μM for 24 hours. (B) Basal OCR/ECAR of cells treated as described above for 24 hours. (C) OCR/ECAR of cells treated as described above for 24 hours following addition of oligomycin. (D) Maximum OCR/ECAR of cells treated as described above for 24 hours following with FCCP in addition to oligomycin.
Notes: * indicates P < 0.05, ** indicates P < 0.01, and *** indicates P < 0.001 compared with control.

