
Figure 1. A high-throughput assay to monitor Drosophila larval feeding.
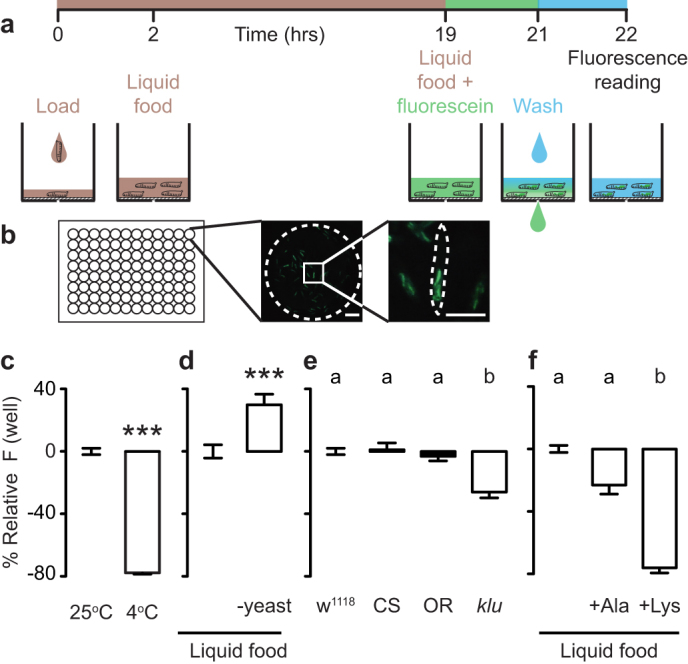
(a) Assay schematic. (b) Representative picture of the bottom of a single well of a 96-well plate with larvae treated as in (a). Scale bars: 250 μm. (c) Relative fluorescence of larvae incubated at either 25°C or 4°C during the fluorescein feeding stage (n = 32). Fluorescence normalized to 25°C. Data were compared using Mann Whitney test. (d) Relative fluorescence of larvae that were pre-fed either complete liquid food or liquid food lacking yeast extract overnight (n = 16). Fluorescence plotted relative to animals fed liquid food. Data were compared using t test. (e) Relative fluorescence of larvae of different genotypes: w1118, Canton-S (CS), Oregon-R (OR), klumpfuss09036 (klu) (n = 22–24). Fluorescence plotted relative to w1118. (f) Relative fluorescence of larvae that were fed liquid food or liquid food supplemented with 400 mM alanine or lysine. Fluorescence plotted relative to liquid food (n = 12). In (e–f), data was compared with Kruskal-Wallis test, followed by Dunn's test. In (c–f), error bars indicate s.e.m. In (c–d) *** p < 0.001. Significant differences are labeled with different letters in (e–f).