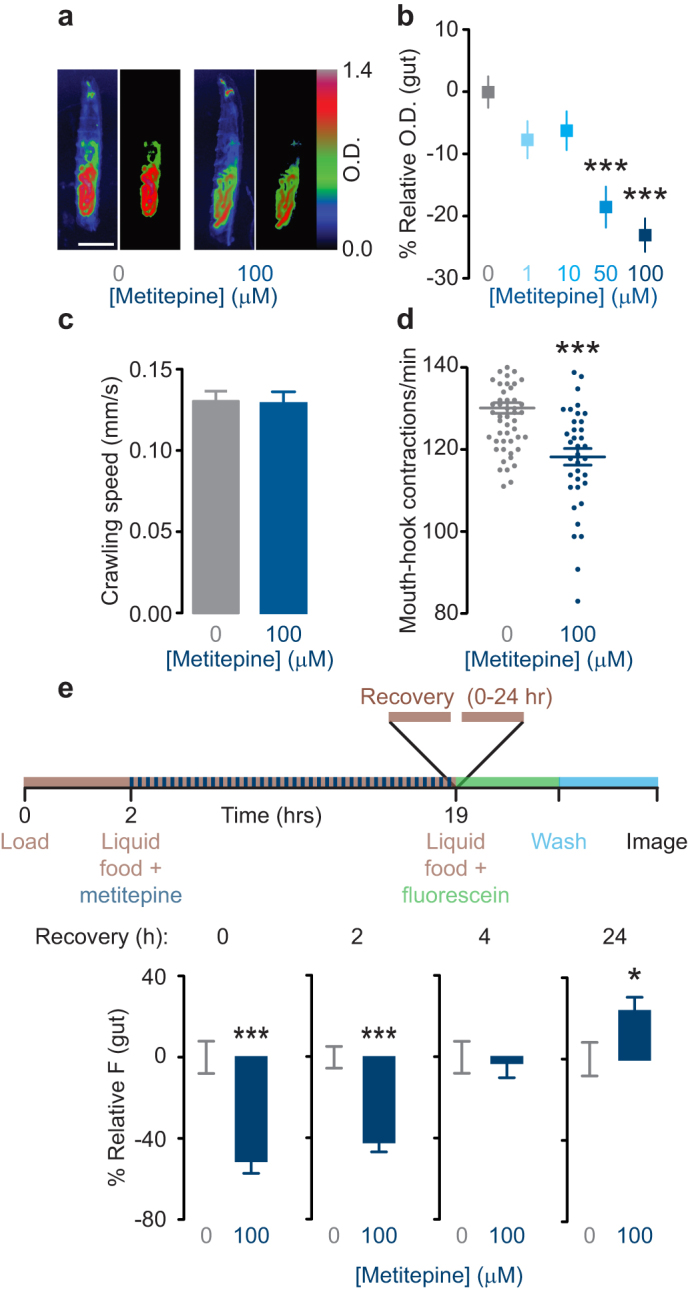
Figure 3. Metitepine decreases food ingestion persistently but reversibly.

(a) Representative pseudo-color pictures of larvae fed either solvent or 100 μM metitepine in solid food with bromophenol blue. In each pair of images, the left is a whole larva and the right is the gut region quantified in MetaMorph. Scale bar: 250 μm. (b) Dose-response effects of metitepine in solid food with bromophenol blue. Y-axis shows relative optical density of gut-region (n = 60 for solvent; n = 28–38 for metitepine). Data were compared using ANOVA followed by Dunnett's test. (c) Crawling speed on an agar surface of larvae treated with either solvent or 100 μM metitepine (n = 18–20). (d) Mouth-hook contraction rate in yeast-suspension of larvae treated with either solvent or 100 μM metitepine (n = 58 and 38, respectively). t test was used for comparison. (e) Time course of recovery after metitepine treatment. The upper diagram shows a schematic of the experiment. Y-axis shows relative fluorescence (0 h: n = 42 and n = 30; 2 h: n = 47 and n = 42; 4 h: n = 43 and n = 45; 24 h: n = 49 and n = 56; for solvent and metitepine, respectively). Mann-Whitney test was used for comparisons. * p < 0.5, *** p < 0.001 compared to solvent-treated controls. In all graphs, error bars are s.e.m.
