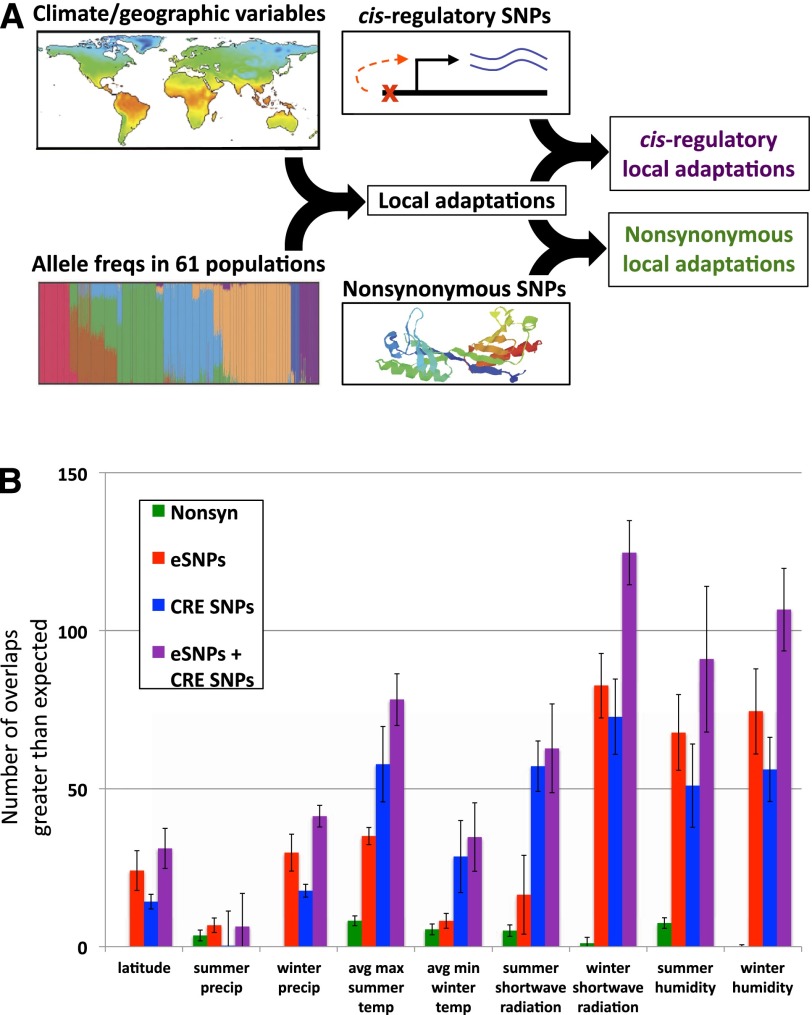
Figure 1.
(A) Outline of the data sets integrated to identify putative local adaptations (Hancock et al. 2011) and to assess the relative importance of cis-regulatory variants compared with nonsynonymous variants among these adaptations. (B) The estimated number of putative local adaptations associated with each of nine climate/geographic variables that are explicable by either a nonsynonymous SNP (green), eSNP (red), CRE SNP (blue), or combined eSNP/CRE SNP (purple). Error bars indicate the standard deviations when randomly sampling negative control SNPs (see Methods). Various controls are shown in Supplemental Figures 1–5.

