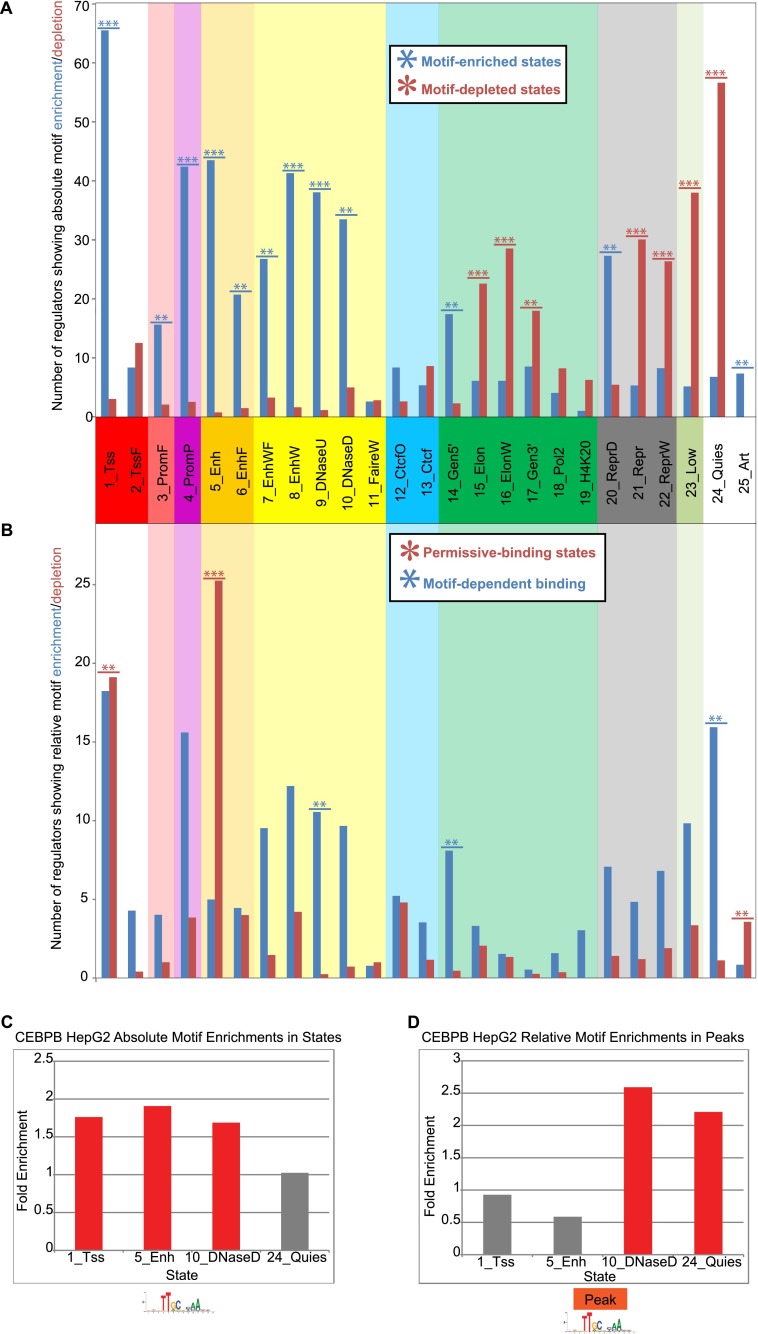
Figure 3.
Motif enrichment and depletion variation across chromatin states. (A) Number of transcription factors with significantly enriched or depleted motif instances in each state at a P-value of 0.001 (see Methods). The maximum value for the y-axis was 79, corresponding to the number of transcription factors considered with regulatory motif instances available. If a transcription factor was profiled multiple times, each experiment was counted inversely proportional to the number of times it was profiled. Stars indicate if the number of transcription factors with significantly enriched (depleted) motifs in a state is significant based on a binomial distribution with the number of samples equal to the total number of significant enrichments or depletions in the state and the probability of success equal to the proportion of significant enrichments (depletions) of all significant enrichments or depletions across all states. Fractional values were first rounded to the nearest integer for the calculation. The P-value cutoff for triple stars was 10−6 and for double stars was 0.01. (B) Number of transcription factors with significantly enriched or depleted motif instances in each state conditioning on regions falling within a peak. Stars were computed the same way as in A except a 0.05 P-value cutoff was used for double stars. (C) Fold enrichment for CEBPB motifs in four different HepG2 chromatin states. (D) Fold enrichments for CEBPB motifs within peaks in the same four states relative to the baseline motif enrichment in peaks.

