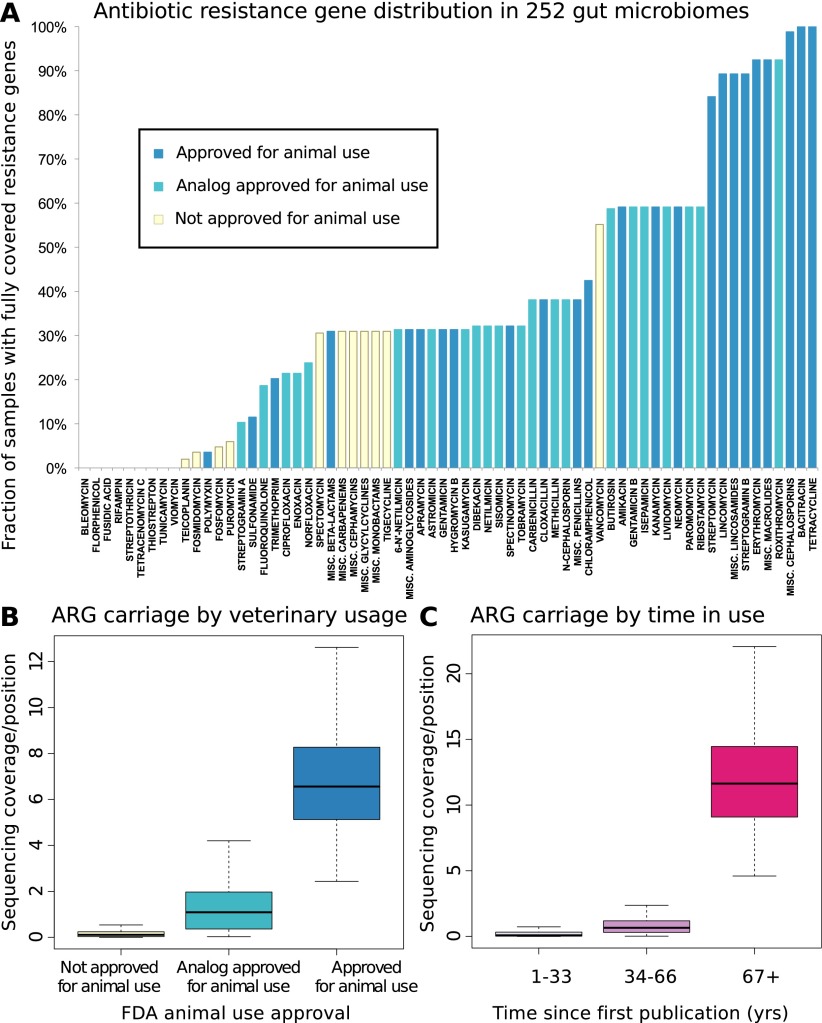
Figure 1.
(A) Resistance gene penetration is higher for antibiotics approved for use in animals or with analogs that have such approval. Shown is the fraction of 252 gut samples where at least one resistance-associated gene is fully covered by sequencing, for members of 66 classes or subclasses (with the most narrow subclasses being single compounds, see Methods) of antibiotics represented in the Antibiotic Resistance Genes Database (ARDB) (Supplemental Table S1), and for which the time since introduction and animal usage approval information was available. The colors of the bars represent whether or not animal use has been approved by the U.S. FDA according to the “Green Book” database (Shields 2009), and whether or not such use is approved for any close analogs of each antibiotic. (B) Antibiotics approved for animal use have significantly (Kruskal-Wallis test for categories having same median, P < 2 × 10⁻¹⁶) higher resistance potential in our data set. The figure shows base coverage per site for resistance genes assigned to categories based on animal use approval. To control for different numbers of known resistance genes targeting each antibiotic (Supplemental Table S1), the average over all resistance gene families are taken. The box plots represent the 252 Illumina samples. (C) Antibiotics that have been longer in use have significantly (Kruskal-Wallis test for categories having same median, P < 2 × 10⁻¹⁶) higher resistance potential in our data set. The figure shows base coverage per site for resistance genes assigned to categories based on how long the antibiotics they protect against have been in use, estimated from the time since first publication for each compound. If an antibiotic has analogs, the age of the oldest analog is used to account for cross-resistances (Supplemental Table S1). The box plots represent the 252 Illumina samples.

