Figure 3.
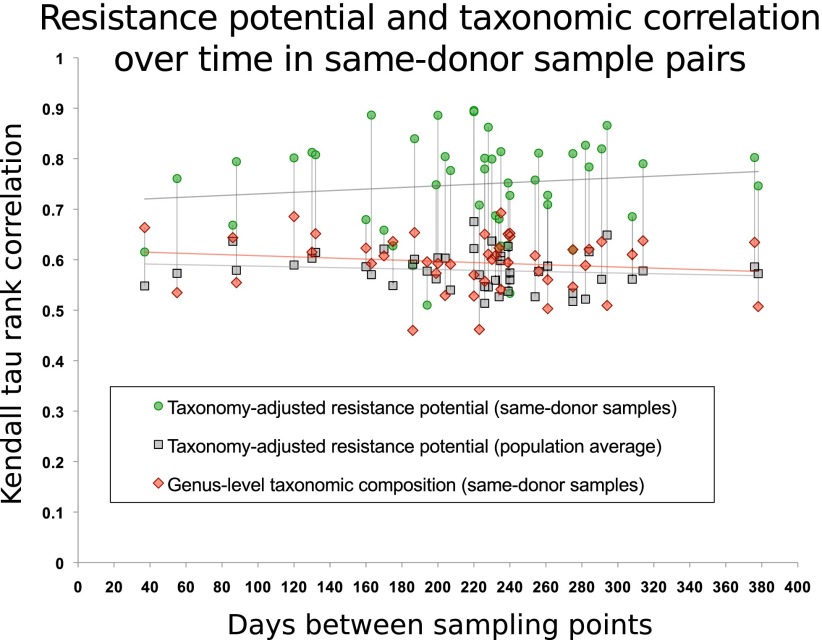
Antibiotic resistance potential persists over time in the human gut flora for at least a year. For 43 U.S. individuals, two or three time points were sampled (The Human Microbiome Project Consortium 2012). Each interval (measured in days) between two sampled time points is represented by a green dot. For each such pair of samples, they are compared with respect to carriage of 99 resistance gene families from ARDB that are detectable in the gut samples, using the Kendall τ correlation coefficient, following compensation for sequencing depth and differences in species composition. The gray dots represent the average correlation between either of the two samples and the remaining 137 HMP samples in the data set. Red markers show the Kendall τ correlation coefficient for genus-level taxonomic composition profiles. Vertical lines connect values for each sample. Linear regression of similarity of same-donor sample pairs with respect to the time interval yields no notable decrease in resistance potential similarity within the time spans considered here (R2 < 0.015). Previous studies (Costello et al. 2009; The Human Microbiome Project Consortium 2012) have shown that the composition of a person's gut microbiome as a whole is self-similar during a year compared with that of other people. In almost every case, resistance potentials are better conserved than overall taxonomic composition.

