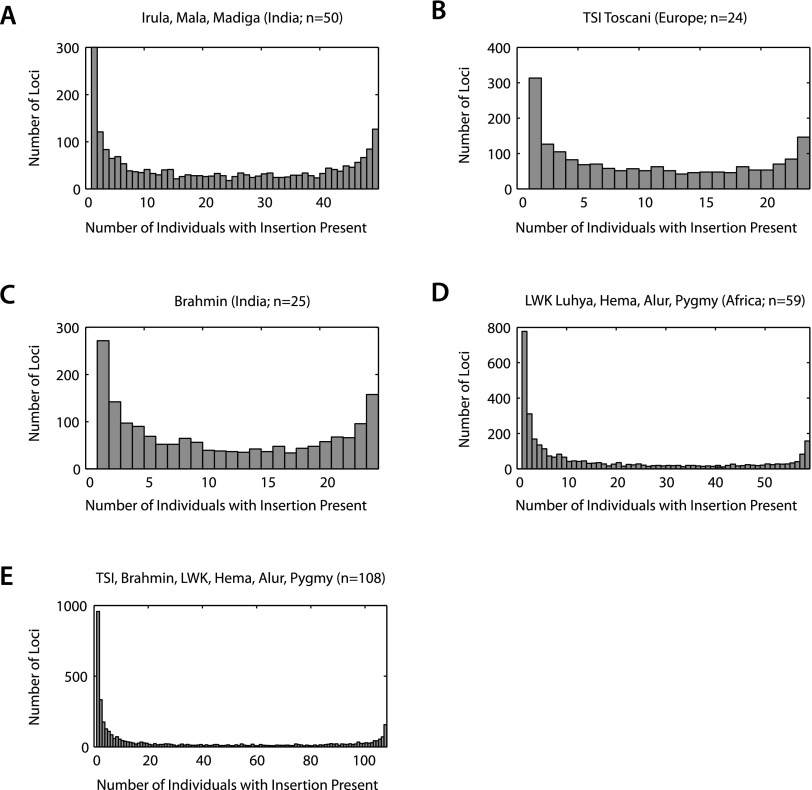
Figure 3.
Insertion presence spectra for 5047 Alu insertion loci in 158 higher-coverage individuals (those with at least 100,000 read sets) from nine populations (excluding the single Vietnamese individual and Venter). An insertion was counted as present in an individual if at least 10 coverage-corrected read sets were observed. Each histogram is constructed from the number of insertion-present states counted for each individual in the population sample across loci that are not fixed present in the sample. (A–E) Spectra for 50 Indian individuals assayed using sequencing primer AluSPv3, 24 TSI, 25 Brahmin, 49 sub-Sahara African individuals, and a pool of 108 higher-coverage individuals assayed using AluSPv2. The spectra represent only those loci out of the 5047 that are present in at least one but not in all individuals in each sample.

