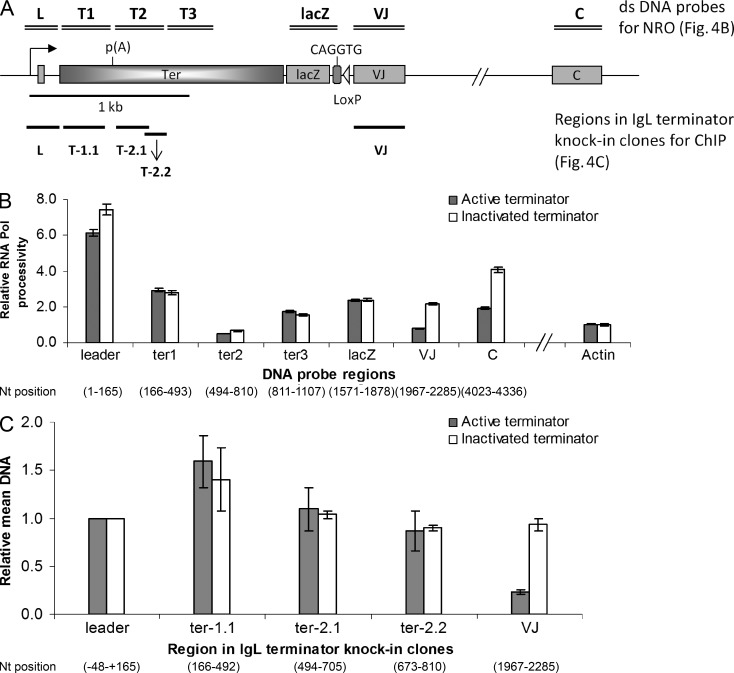
Figure 4.
NRO and ChIP assays. NRO and ChIP analysis of the active and inactivated terminator knock-in clones. (A) Map of the rearranged Ig light chain locus in the chicken B cell line DT40. The dsDNA probes used in the NRO assays are shown by double bars on the top, and the regions analyzed with the ChIPed samples are shown by single bars at the bottom of the map (not drawn to scale). (B) NRO: Bar graphs show relative Pol transcriptional activity at the various regions in the active and inactivated terminator knock-in clones. The values are normalized for chicken β-actin levels, background hybridization, and incorporation of α-[32P]-UTP. (C) ChIP with antibody against Pol. Bar graphs indicate relative mean levels of immunoprecipitated DNA over input DNA by quantitative PCR, normalized for β-actin. The data represent means and SDs of three independent experiments with one of the active and inactivated terminator cell lines.

