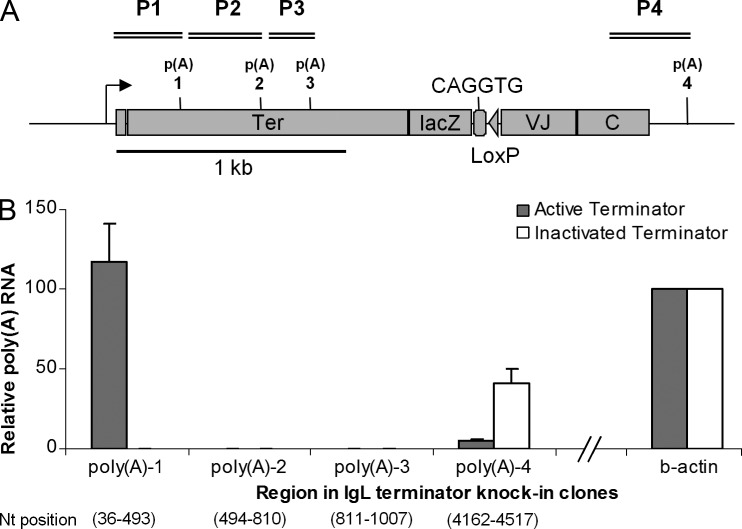
Figure 5.
Poly(A) RNAs. (A) Region P1– Region P4 in the active and inactivated terminator knock-in clones (not to scale). (B) Polyadenylated RNA Assay. Bar graphs show relative poly(A) RNA levels reverse transcribed with oligo-dT primers and PCR amplified with region-specific primers; the values are normalized with chicken β-actin levels and primer efficiencies. The numbers at the bottom indicate start and end nucleotide positions of the respective regions. The data represent means and SDs of three independent experiments with two of the active and inactivated terminator cell lines.

