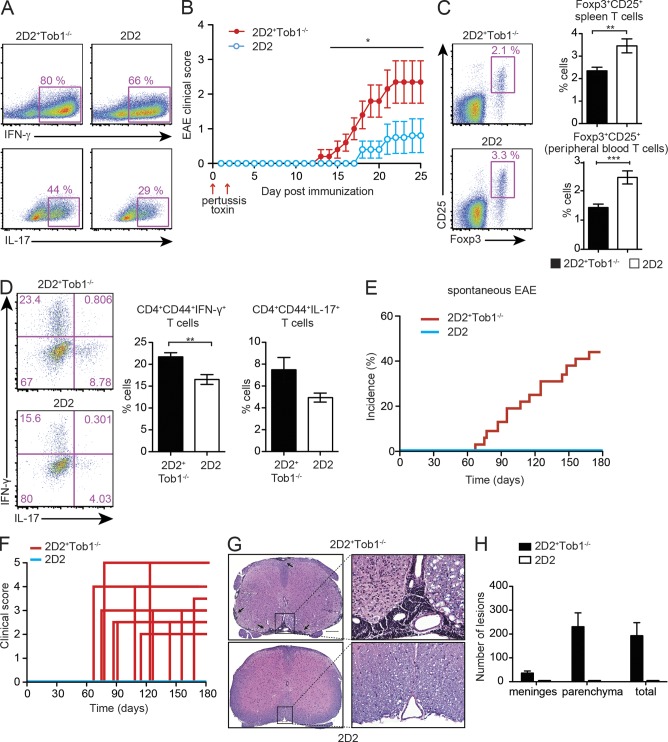
Figure 4.
Tob1 deficiency in myelin-specific T cells favors development of spontaneous EAE. (A) Naive (CD4+CD44−CD62L+) T cells were isolated from MOG35-55 TCR-transgenic mice (2D2) and 2D2+Tob1−/− mice and cultured in the presence of purified APC and antigen (MOG35-55). Polarization of T cells into a Th1 lineage was induced by IL-12, and polarization into a Th17 lineage was induced by IL-23, IL-6, and TGF-β. Intracellular cytokine staining for IFN-γ and IL-17 after 3 d in culture is shown. (B) Incidence of EAE after administration of ptx in 2D2 (n = 5) and 2D2+Tob1−/− (n = 5) mice. Mean EAE disease score ± SEM is shown. (C) Splenocytes (n = 7) and peripheral blood (n = 14) of age-matched (60–80 d old) symptom-free 2D2 and 2D2+Tob1−/− mice were analyzed for the proportion of Foxp3-expressing (CD25+Foxp3+) CD4+ cells. (D) Similar to C but the proportion of activated (CD44+CD4+) IFN-γ– and IL-17–secreting splenocytes is shown. Error bars indicate SEM. (E and F) The incidence (E) and disease severity (F) of spontaneous EAE in 2D2 (n = 25) and 2D2+Tob1−/− (n = 32) is also increased compared with the 2D2 line. (G) Histology of representative spinal cord samples (Luxol fast blue–hematoxylin and eosin). Meningeal and parenchymal lymphoid infiltrates in a 93-d-old 2D2+Tob1−/− mouse (top). A representative spinal cord section from a 165-d-old 2D2 mouse is shown for comparison (bottom). Bar: (left) 200 µm; (right) 50 µm. (H) Lesion quantification of meningeal and parenchymal inflammatory foci. For all experiments, data shown are representative of two independent experiments. Error bars indicate SD. For all experiments, *, P < 0.05; **, P < 0.01; ***, P < 0.001, Mann-Whitney U test.

